
By D. Sherman Okst

So how big is the real estate bubble?
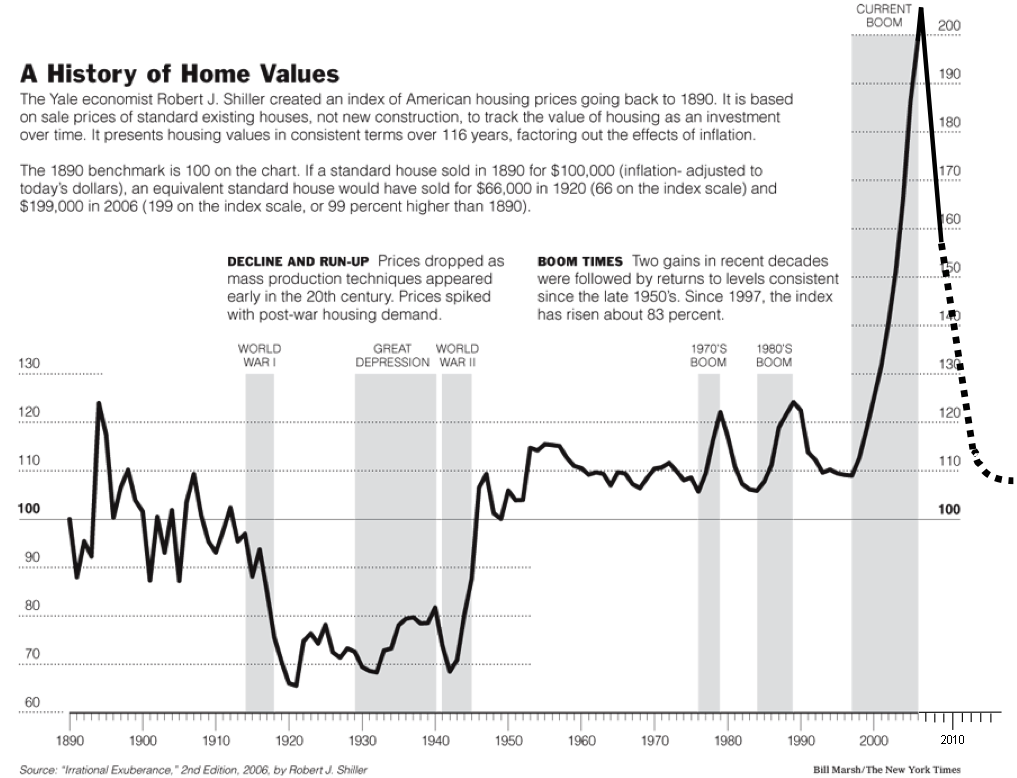
It is about seven times as big as any bubble we have ever seen before. There are a lot of misnomers when it comes to real estate. The biggest one is that house prices always go up. That is wrong. House prices really follow inflation and deflation. Take a look at the chart below. You can see that for 110 years house prices have for the most part been in a channel between 100,000 and 120,000 dollars adjusted for inflation.

Now lets look at the past two bubbles (green) and the current bubble (yellow).
Without any doubt, this is the mother of all bubbles.
Worse, no economist I read has really predicted how bad it is. In the 60 minute clip they came close. The problem of dot connection, yet once again, is apparent. Here is the issue: These economists on the video are griping over 4.5-5.0 million homes in inventory, an increase from 2.3 million homes, an 11-month glut of homes. But, and this is a very big “BUT,” THERE ARE OVER 19 MILLION VACANT HOMES.
Vacant homes indicate quite a few things and none of them are positive: Investors that didn’t get rich got stuck, or are at the very best sitting with homes they can’t even get qualified renters in, people bought vacation homes and shouldn’t have, and people who bought homes and shouldn’t have. Then you have people who should have bought homes and then were adversely effected by those who shouldn’t have. Vacant homes inevitably detract value from adjacent populated homes.
Banks are slow to put homes on the market. Many investors are waiting this out as economic pundits call for bottoms in the near future (trust me, I’m not one of them). Many people can’t get a job elsewhere or can’t sell to move. Bottom line, the “Overhang” that they talk about in the 60 Minutes video is predicated on 4.5-5.0 million homes. It really is an OVERHANG of about 24 million homes when you add the vacant 19 million to the on-the-market 5 million– and as the video says, it is going to get worse as wave two (Alt-A’s and Option Arm) defaults roll to shore.
Think Tsunami.
If Wave 1 caused the Dow to drop from 14,000 at the height of the real estate bubble to low 7,000s now, then what do you think Wave 2 that they talk about in 60 minutes will do to the economy and to real estate prices and the stock market?
As an aside, you can also see the tech bubble of the late nineties in the above chart.
Previous: Part 1.
---
D. Sherman Okst is an Augusta County resident who with his wife runs a small technology business. He reads extensively and studies the economy blogging as "Davos" at the Daily Digest, a column for Chris Martenson, which gets 1.5+ million reads a year. Sherman writes code, was a high school computer science teacher, and ex-airline captain with 15,000 hours and 18 years of service. He was a builder, managed a lumber yard and as a kid was a mate on a fishing boat. Sherman has also had work published in a few magazines.
1 comment:
I'd question the 19 million empty home number. Do the math on how many homes would have to be empty in Virginia.
The number that needs to be known is the bottom line for bad mortgages. Is it $1.7 trillion number or $750 billion - as I've heard or what? That is how big the bubble is.
Post a Comment